Category: General

  • Digital readiness checklist

    Digital readiness checklist

    Today 85% of U.S. adults are online, 64% are on Facebook, and a full 56% of us have a smartphone glued to one hand 1. Digital natives and immigrants alike are now accustomed to using technology in the flow of daily life. Previously discrete activities like checking email, posting photos to social networks, and shopping online, are now worked into pauses in the Starbucks line or on a conference call. But how do increasing digital fluency and integration manifest themselves in people’s professional lives?

    It’s not always obvious how consumer-led digital fluency is resulting in enterprise business benefit. Sure, the rise of consumerization of IT has led to initiatives like Bring Your Own Device that bring workplace technology services more in line with personal technology expectations. But there’s still a gap between what people do in their personal use of digital, and their readiness to apply this knowledge to business challenges.

    Below is one framework we’ve had some success with lately when assessing digital readiness in large organizations.
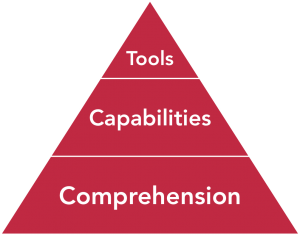
    digital readiness framework

    The process starts from the bottom, by assessing general comprehension of digital technology and how it might be applicable to traditional business processes.

    • Are employees aware of ways technology is affecting their industry?
    • Is technology used only to replicate offline processes faithfully online, or are both processes and practices consistently revisited?
    • Are employees able to relate and apply general digital practices to specific business benefit?
    • Is the language expanding? Are non-IT employees developing a basic vocabulary for digital?

    Next, employees must develop the capabilities, through a blend of directed training and hands-on learning, to use new digital and social tools.

    • Are there both formal training and peer-to-peer learning opportunities for employees?
    • Are employees aware of and able to use basic collaboration technology, from project websites to link sharing?
    • Are employees able to monitor and listen through digital and social communications to inform and advance their work within and beyond the organization?
    • Are employees aware of ways they can create and publish content, whether through websites or social media?

    Finally, does your organization provide employees with a clear selection of tools that enable new behaviors or increase efficiency.

    • Do employees know how to find what they need to solve a problem, and who will support it?
    • Are employees involved as advisors in the technology selection and rollout processes?
    • Are there user testing protocols in place before tools are rolled out to employees?
    • Are tools regularly benchmarked against consumer-led systems?

    A typical mistake in technology-led rather than business-led digital initiatives is to start at the top of the pyramid with the tools, and then try to reverse-engineer business processes around them. Savvy organizations will start from the business need and raising comprehension of digital as it applies to the business. These organizations will also cope with some heterogeneity of tools in order to drive adoption, rather push for a monolithic approach that creates endless skunkworks workarounds.

    There are some terrific frameworks out there to assess your organization’s readiness for digital transformation or social business maturity. Use this digital readiness checklist as a first step toward understanding your employees’ ability to engage in digital to advance the organization.

    1 Pew Internet

  • Friday 5 — 12.13.2013

    Friday 5 — 12.13.2013

    1. Instagram Direct lets you send your photos, videos, and messages to select recipients. While comparisons to Snapchat feature prominently in the media coverage, this feels more like a catch-up feature like its video announcement back in June. One new ephemeral capability: you can delete your photos from recipients’ phones.
    2. In another Snapchat-response move, Twitter announced you can direct message photos — along with a bunch of other enhancements designed to keep you in-app longer. Smooth new swiping action in the mobile app lets you see activity and “discover” more easily.
    3. Canadian messaging company Kik at 100 million registered users may already be bigger than Snapchat, which declines to disclose its numbers. Kik’s support for HTML5-based content provides more flexibility to download games and content in-app — a big bet on the Web as its future.
    4. Chart geeks, rejoice! In this season of best-ofs, the Wire has compiled the best 2013 charts. Big momentum behind fruit flavored candy with Jolly Rancher, Twizzler, and Starburst rising in Twitter mentions (and, allegedly, sales).
    5. Open source software is eating itself, with more projects emerging and competing with one another throughout the stack. How can an enterprise know where to place its bets? Look for a strong community supporting the project, and code activity (releases, commits/month).

    youtube trends

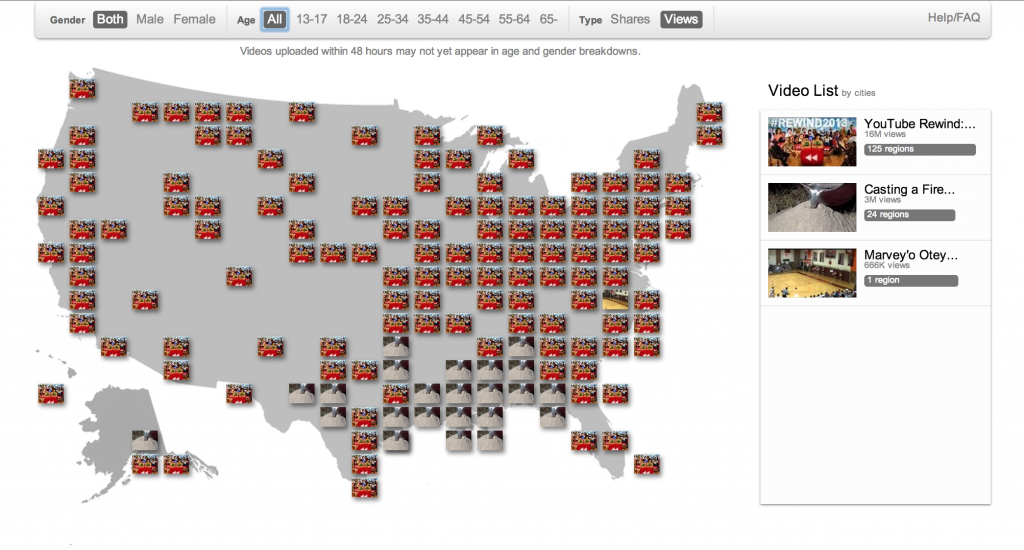
    Weekend fun: YouTube Trends tell me that most of the country is watching 2013 rewind, so I guess you should be, too. I mean, it would be really depressing to dwell on the fact that all this stuff from 1994 is now 20 years old.

    Every Friday, find five, highly subjective links about compelling technologies, emerging trends, and interesting ideas that affect how we live and work digitally.

  • Four Ways to Scale Digital Capabilities Beyond Your Team

    Four Ways to Scale Digital Capabilities Beyond Your Team

    Posted over at Harvard Business Review blog network: Digital today is part of everyone’s job — and many enterprise organizations are adopting strategic mobile, social, and cloud initiatives to educate and empower employees. But these organizations still face a daunting challenge in distributing digital expertise: how do you develop digital competency more broadly across a large organization?

  • Friday 5 — 12.6.2013

    Friday 5 — 12.6.2013

    google trends

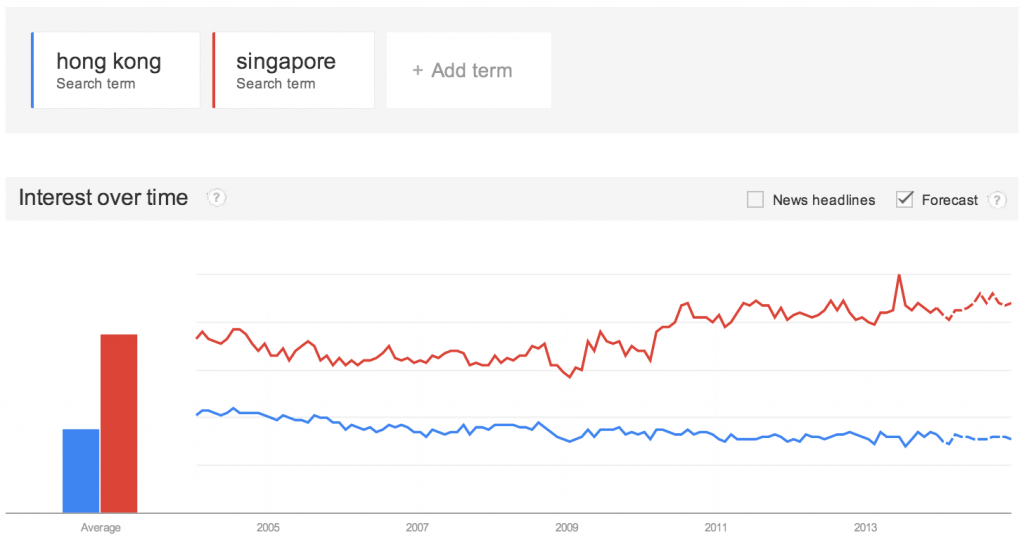
    1. Google Trends is a handy, visual tool for comparing topics by their relative search volume — see graph of search trends for Hong Kong and Singapore above. This latest release uses its vast historical data to offer dotted-line predictions of future search interest. Another useful feature: the algorithms now aggregate different searches likely to be related.
    2. Foursquare has released a new version of its check-in service, with a sleek new design and location-aware push recommendations. Just arrive at the Beat Hotel in Cambridge? Now Foursquare may suggest the tuna spring rolls based on your friends’ behavior. Since its 2009 launch, Foursquare has amassed a significant location data layer, and this release may be one way — apart from its rich API — to take advantage of it.
    3. Monday Note pulls together a number of recent charts to recommend mobile trends to keep in mind if you produce digital news. Thoughtful validation of the power investment in content strategy, with “newsletters designed for mobile that are carefully — and wittily — edited by humans.” Mobile news consumers on smartphones need more than automated headlines and snippets to keep their attention.
    4. In case you missed it, here’s a great post on Boston tech company / innovation economy performance. Fun fact: 51% of Boston’s “massive winner” companies had an immigrant founder.
    5. Did Apple’s U.S. mobile hardware marketshare peak at 40%? Latest Comscore data spots a flattening trend, compared to a gradual rise of Samsung devices now at 25%. Google’s Android still dominates with 52% of the U.S. mobile software platform market.

    Weekend fun: Sherlock fans and other Cumberbatch disciples, you are in for a real treat: Here’s a video of Benedict Cumberbatch reading R. Kelly’s Genius lyrics.

    Every Friday, find five, highly subjective links about compelling technologies, emerging trends, and interesting ideas that affect how we live and work digitally.

  • Enough said


  • Effective data visualization, football edition

    Effective data visualization, football edition

    Arsenal standingsAs an Arsenal fan (the London team that’s currently first in the Premier League, a fact I try to work speciously into every conversation), I spend far more time than I should reading about soccer/football online. Like many sports, football is a goldmine of data from goals to assists to caps. In addition, football (unlike American football) is a game played globally, so there’s rich data about the rapid rise of player transfers internationally. And as the game became commercialized — it’s now the Barclays Premier League — the money moving around gets exponentially larger. All this data has been captured in a compelling and slightly addictive interactive visualization by Mac Bryla.

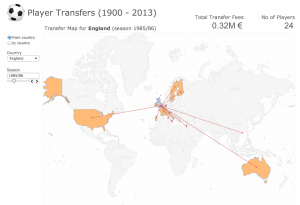
    Back in 1965, when Bobby Moore was leading West Ham to FA Cup Victory, only one player transferred from England for a total of .02M €.  By 1986, when Gary Lineker is playing for Everton, you can see how far the England players are traveling:

    transfers 85-86

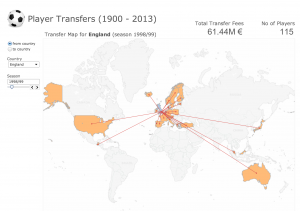
    Fast forward to 1990 when David Beckham is at his peak, and you can see 115 English players fanning out across the globe, and the rise of money changing hands reaches 61.4M €.

    1989-90 transfers

    By 2012-13, it’s up to 221 players and 151.3M €. So if you scroll through the visualization you can see very little until the 1970s, and then tremendous growth in moves and dollars that could be compared in interesting ways to the rise of television, the World Cup winners, the popularity of soccer in the U.S., or even the growth of the internet.

    What makes this data visualization work so well? First, while it’s not a breathtaking design, it’s clean and functional. The experience is also intuitive — the user can easily see the variables (explore by year; to and from country) that can be manipulated. Finally, the designer has done for us the most difficult job of all: winnowing out all the other facts (country of birth, team transfers, tenure abroad) that might be interesting data but would muddy this interface.

  • Friday 5 — 11.29.2013

    Friday 5 — 11.29.2013

    1. Shopping on your mind today? Jeremaiah Owyang posted Ten Trends for the Progressive Retailer. Not sure how far “purpose beyond profits” will go, but some very interesting ideas here about how companies will use data about customers to reward behaviors, and the impact of sharing as a business model.
    2. Betaworks, the tech studio that brought us useful services like Chartbeat and bloglovin as well as sinister time wasters like dots, is raising another 20 million. Betaworks has always supported great ideas and terrific design in nascent companies. This round may allow the studio to do more with its existing adolescent companies like bit.ly and Digg.
    3. A new report from Ovum determines “social messaging” is big and getting bigger quickly, with over 2B users by the end of 2014. These messaging apps are acquiring users, growing time in-service through expansion into games and payments, and finding paths to monetization. This growth and user behavior change have implications for both legacy “desktop-first” social networks and SMS providers.
    4. For years companies and pundits have analyzed Twitter as an input to understand public opinion and predict election results. Now the South Korean Intelligence Service is alleged to have posted more than 1.2 million tweets to sway a presidential election. Not the first instance of astroturfing, but what some are calling “a systematic and massive intervention in elections”.
    5. Testing is the least sexy word in any digital development process. You’ll pack the house for a presentation of mood boards or a design review, but your audience vanishes when the conversations turns to usability, accessibility, or load time. Here’s a practical breakdown of useful testing considerations.

    NYT On ItWeekend fun: Check out ten hilarious Twitter feeds to be thankful for. My own addition, especially in this holiday season of specious, multi-column trends pieces: The Times is On It (@NYTOnIt).

    Every Friday, find five, highly subjective links about compelling technologies, emerging trends, and interesting ideas that affect how we live and work digitally.

  • Happy Thanksgiving (and stay dry)

    rain
    Winding down in the wet for the break — Happy Thanksgiving and safe travels!
  • Let’s ditch the term m-commerce

    Let’s ditch the term m-commerce

    mobile purchaseIt’s a sure thing — as soon as the temperature on the East Coast falls, Christmas carols fill the air and people begin to make predictions about retail performance over the holiday season.

    The term “Black Friday” originated around the early 1960s, and referred to the day after Thanksgiving when a large volume of retail shoppers made businesses’ ledgers “in the black”.  E-commerce became a popular, annual media topic in the late 1990s, back when it was a small but avidly measured piece of the overall retail puzzle. By 2005, a retail marketing association had dubbed the Monday after Thanksgiving Cyber Monday, a day online shoppers chased deals through an increasingly mainstream medium.

    Predictably, in a year where we’ve reached 56% smartphone penetration among U.S. adults, this holiday season a number of well-timed reports have emerged about mobile commerce. The reports highlight facts like 55% of all time spent with online retail in June 2013 occurred on mobile and mobile will account for nearly 13% of all U.S. e-commerce sales. Google has even released a calculator for retailers to assess how mobile can drive in-store sales.

    The best of these reports acknowledge that we’re not talking about different consumers in each of these channels. So, let’s ditch the term “m-commerce” and avoid creating another discrete silo. Just as online banking is now just banking, mobile commerce is another touchpoint along the continuum of commerce. Let’s measure and optimize the channel, but focus on integration of in-store and seamless, multiscreen approach to recognize and serve consumers best.

  • Friday 5 — 11.22.2013

    Friday 5 — 11.22.2013

    1. Spotify closes another $250M in funding at a >$4B valuation. The streaming music service enabling instant listening now has more than 6 million paid and 24 million active free users.
    2. Is it inciting generational warfare to imply that the youngs shape the direction of technology differently and more significantly than the olds? Mathew Ingram makes the case.
    3. Last year I read Thinking Fast and Slow, a thought-provoking book about the different systems of thinking and their applicability to life and work. Recently Sonya Song wrote in Nieman Lab about how these two modes of thinking, fast and slow, attract two different types of attention. Interesting implications for individuals and organizations sharing content to social.
    4. Most people frustrated by carrying a phone and a wallet everywhere they go were pleased by the widely-publicized launch of Coin. The digital all-in-one credit card last week met a $50K crowdfunding goal in 40 minutes. This week, Coin is answering criticisms about security and design flaws.
    5. Wondering how to plan for and execute a redesign of a  highly-trafficked digital property? You could do worse than read Brad Frost’s write-up of how he and his colleagues achieved the Techcrunch redesign. The part about development being part of the design process is key — the days of designers throwing PhotoShop files over the transom to front-end developers are long gone.

    Weekend fun: I’m sure you’ve seen Jean-Claude Van Damme in his brilliant self-parody for Volvo already. Instead, in honor of Harvard-Yale weekend, how about some Harvard students giving fake tours of Yale (“if I hit the floor, you do the same”)?

    Every Friday, find five, highly subjective links about compelling technologies, emerging trends, and interesting ideas that affect how we live and work digitally.